
HOMER Grid 1.9

After you click the Calculate button and the calculation is complete, HOMER automatically displays the results in Tabular mode. Click a sensitivity case in the upper, Sensitivity Cases table to view, sort, and filter all the feasible simulations that were run for the selected sensitivity case in the Optimization Results table.
HOMER's graphical and tabular output capabilities allow you to efficiently analyze all that data. Click either the Tabular or Graphical radio button to see the information in the respective format. The tabular presentation is described below. See the Graphs Mode section of the help for a description of various ways you can select and view the information in plots.
The Optimization Results page shows calculation results in tables, or Tables mode, by default. The Tabular radio button is selected in the upper, right of the page. You can change this presentation by checking the Graphical radio button.
Tables Mode
The Optimization Results table lists all the feasible simulations for the selected sensitivity case. (Non-feasible systems are not shown.) When you fist see the Optimization Results table, the results are categorized and filtered by system type. The radio buttons above the Optimization Results table allow you to filter the list of feasible systems according to system type. The two choices, Overall and Categorized, are explained below.
Click the row of the sensitivity case in the Sensitivity Results you want to view in the Optimization Results table. Sensitivity variables appear in the left-most columns of the Sensitivity Results table. HOMER updates the list of systems in the Optimization Results each time you make a selection from the Sensitivity Results table.
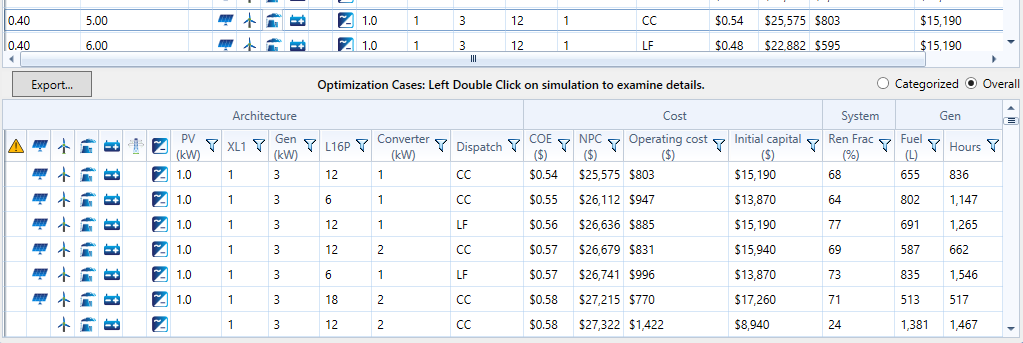
If you choose to display the overall system rankings, HOMER shows the top-ranked system configurations according to net present cost. An example is shown below. The numbers under the Architecture section indicate the presence of each type of component under consideration. In this example, the icons indicate the presence of, from left to right: PV, wind turbines, diesel generator, batteries, a grid connection, and the converter. To the right are several columns that indicate a few summary values drawn from the simulation results of the least-cost system, such as the initial capital cost, operating cost, and total net present cost.
Tip: Double click any system in the list to see detailed Simulation Results.
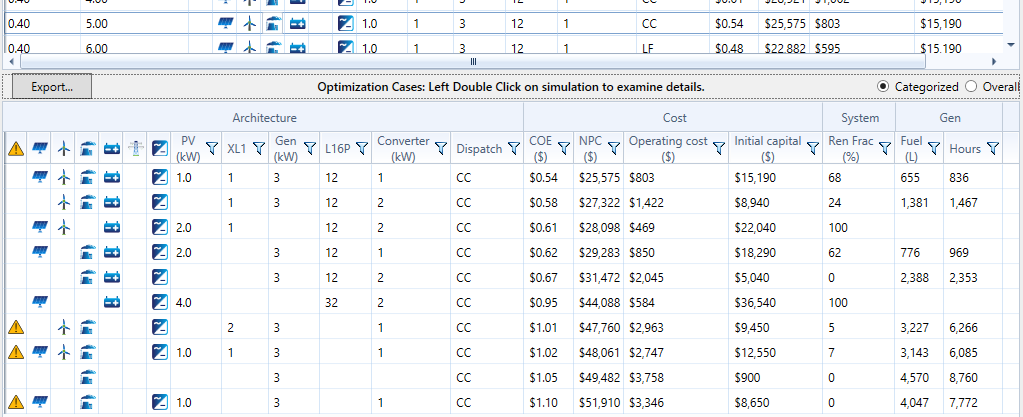
The overall rankings are typically dominated by two or three system types. In the above example, the top systems are all either wind/generator/storage or PV/wind/generator/storage systems. For a broader comparison, select Categorized from the drop-down menu above Filter by Architecture. The categorized rankings show the least-cost system of each type. In the example shown below, the top-ranked system corresponds to the top-ranked system in the overall rankings shown above. But the second system listed corresponds to the seventh-place system in the overall rankings, because the second-place system in the overall rankings was of the same type as the first-place system.
The second system from the bottom in the categorized rankings is interesting for comparison because it represents the least-cost pure diesel system. This system appears so far down in the Overall ranking that it is hard to see. The Categorized ranking makes it easy to compare this system with the other alternatives.
Tip: Double click any system in the list to see detailed Simulation Results.
Sorting and Filtering Results
You can sort the Results table by any column in the table. To filter the results, click the Funnel icon (pictured below) in the heading of the column and specify the values of the selected column that you would like to see from the drop-down menu.
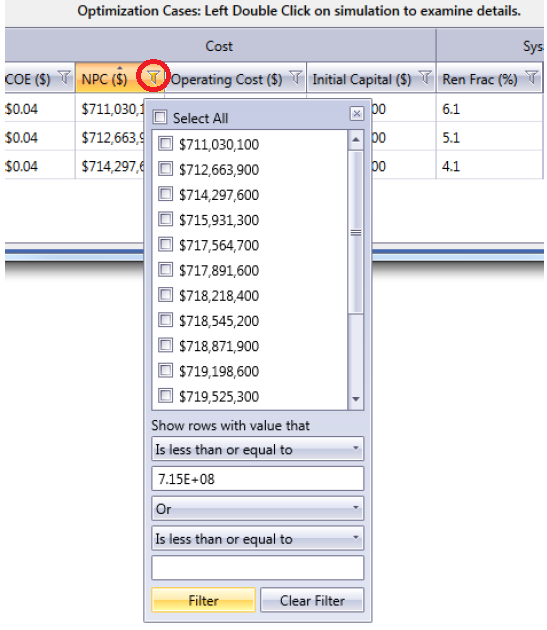
When the filter is active, the Funnel icon turns yellow.
![]()
To sort the results, click the heading of a column. One click sorts the results by that column in ascending order. Click again, and the sorting switches to descending order for that column. If you click a third time, the sorting is removed, and the table returns to the default sorting, which is by net present cost (NPC), ascending.
See also
