
HOMER Grid 1.9

The Sensitivity Cases table on the Results page ranks all the feasible systems from HOMER's sensitivity analysis. A sensitivity analysis can result in a large amount of output data. Every simulation that HOMER performs results in several dozen summary outputs (like the annual fuel consumption and the total capital cost) plus about a dozen arrays of time series data (e.g., the output of the wind turbine). HOMER typically performs hundreds or thousands of these simulations per sensitivity case. A sensitivity analysis can easily involve hundreds of sensitivity cases.
HOMER's graphical and tabular output capabilities allow you to efficiently analyze all that data. Click either the Tabular or Graphical radio button to see the information in the respective format. The tabular presentation is described below. See the Graphical Mode section of the help for a description of various ways you can select and view the information in plots.
Tables Mode
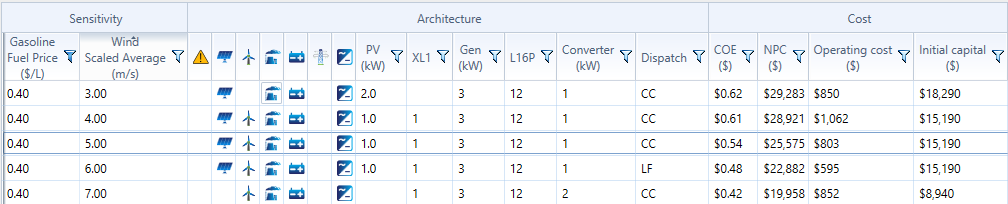
The table sensitivity results consist of a list of the lowest-cost system for each sensitivity case. In the example below:
•The first two columns display the values of the two Sensitivity Variables: the diesel fuel price (Gasoline Fuel Price) and the wind speed (Wind Scaled Average).
•The next five columns contain values indicating the presence and size of the five components under consideration in the lowest-cost system. From left to right, they are batteries, the diesel generator, wind turbines, PV panels, and the converter.
•The following several columns show summary values drawn from the simulation results of the least-cost system including initial capital, operating cost, and total net present cost.
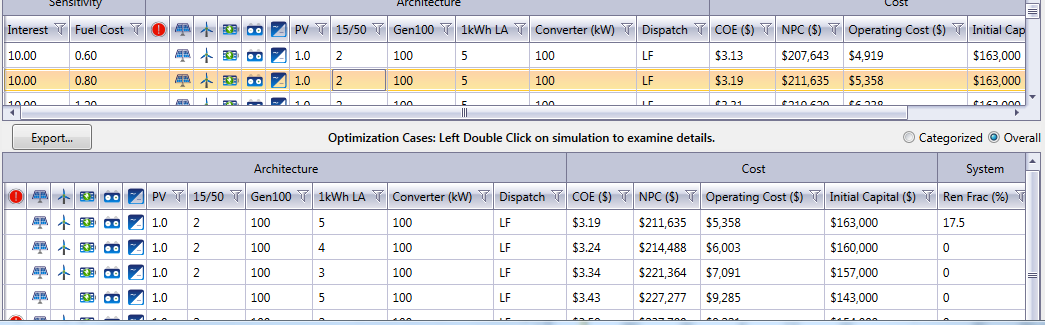
You can click on any row in the table to see the Optimization Results table for that sensitivity case, showing the sub-optimal systems (that were not lowest-cost options). You can click the row for a system to view the Simulation Results window for any of the ranked systems.
Sorting and Filtering Results
You can sort the Results table by any column in the table. To filter the results, click the Funnel icon (pictured below) in the heading of the column and specify the values of the selected column that you would like to see from the drop-down menu.
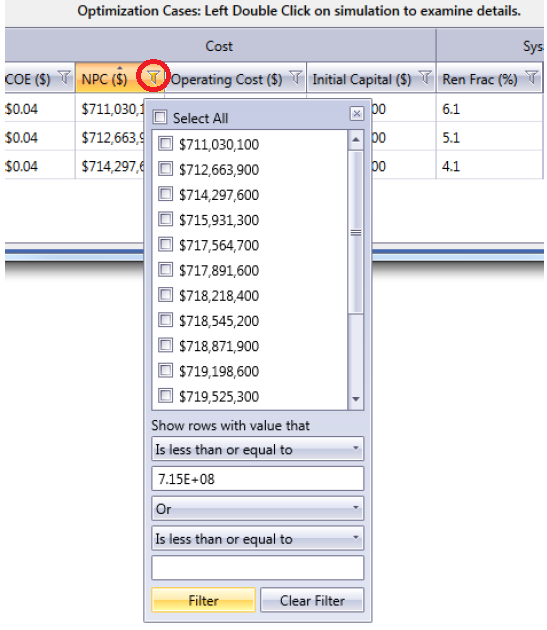
When the filter is active, the Funnel icon turns yellow.
![]()
To sort the results, click the heading of a column. One click sorts the results by that column in ascending order. Click again, and the sorting switches to descending order for that column. If you click a third time, the sorting is removed, and the table returns to the default sorting, which is by net present cost (NPC), ascending.
See also
