HOMER Grid 1.9

Double-click a row in the Optimization Results table to open the Simulation Results window for that system. At the top of the window is the system Net Present Cost, the System Architecture (the components of the system), and Sensitivities (the sensitivity case being used).
The Simulation Results window always contains the following tabs:
•The Cost Summary tab displays the total cash flow, categorized either by component or by cost type.
•The Cash Flow tab displays the year-by-year cash flows in a customizable graph.
•The Electrical tab displays details about the production and consumption of electricity by the system.
•The Emissions tab displays the annual pollutants emitted by the system.
The Simulation Results window may also contain the following tabs, depending on the equipment included in the system:
•The PV tab shows details about the operation of the PV array.
•The Generator tab shows details about the operation of the generator.
•The Fuel Summary tab gives a summary of fuel usage for each fuel type in the model.
•The Storage tab shows details about the use and expected lifetime of the storage.
•The Utility tab shows details about the sales and purchases to and from the grid.
•The Converter tab shows details about the operation of the inverter and rectifier, including capacity, electrical input and output, hours of operation, and losses.
•The Thermal tab shows details about the production and consumption of thermal energy by the system.
•The Electric Heater tab shows details about the heat production of the thermal load controller component.
•The Boiler tab shows details about the operation of the boiler. Systems with thermal loads always contain boilers.
•The Resilience tab shows detailed about the outage.
•The Electric Vehicle tab show details about EV consumption and vehicle charging sessions.
In addition to the tabs, the Simulation Results window also contains several buttons along the bottom of the window:
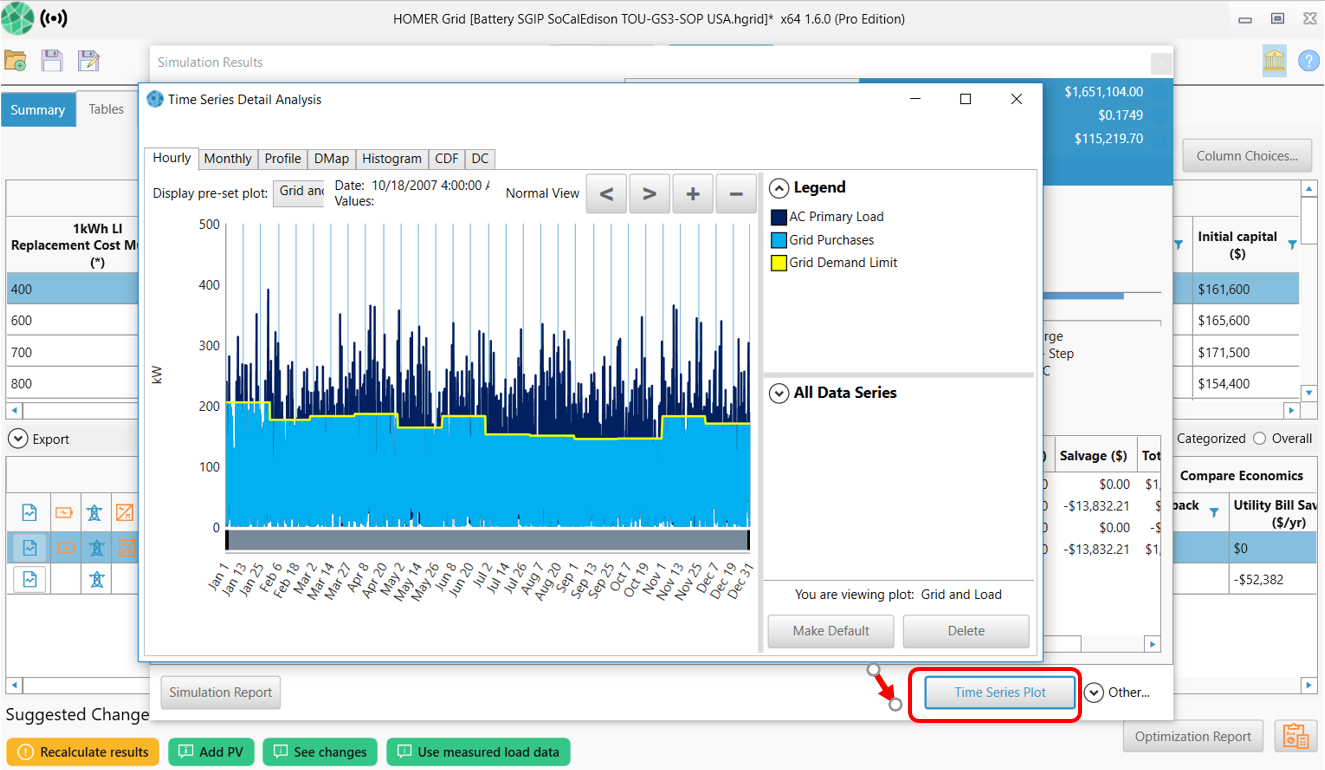
•The Time Series data buttons allow you to analyze those variables that HOMER stores for each time step of the simulation. The buttons for time series analysis are: plot, scatter plot, delta plot, table, export and Multi-Year
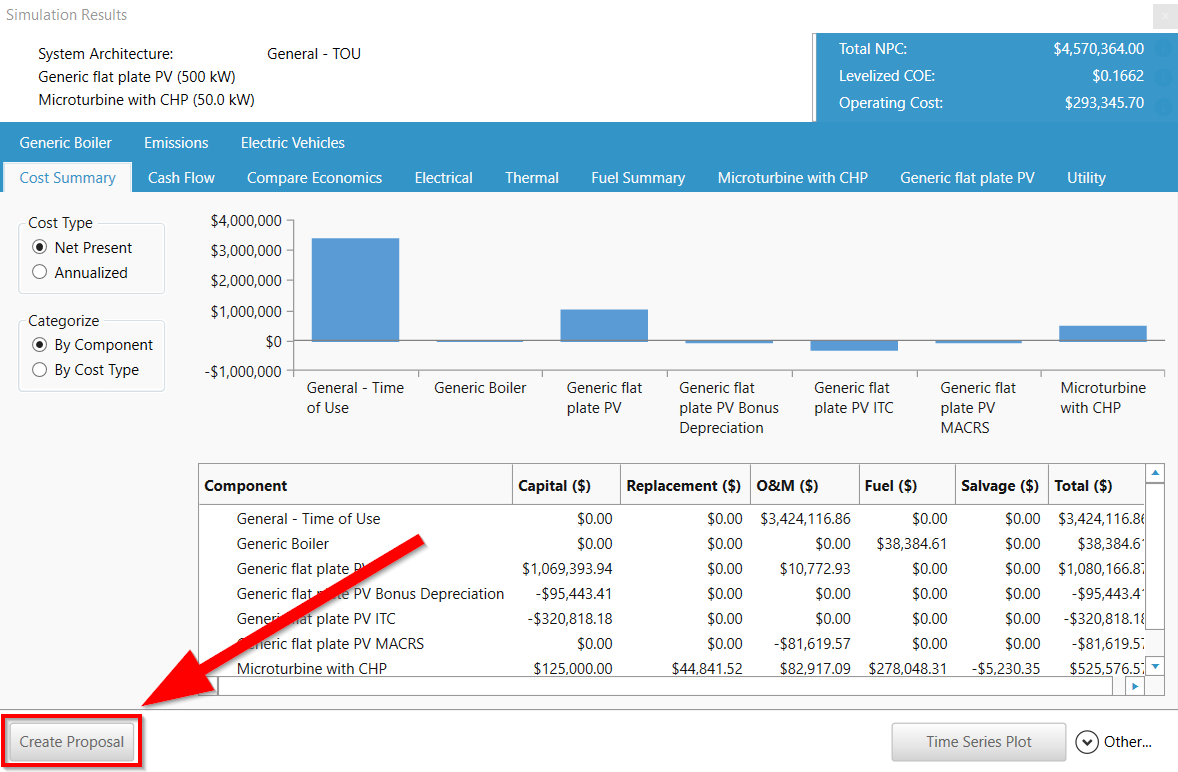
•The Create Proposal button allows you to print a report with basic information about the system. You may customize the report to show selected sections and graphs
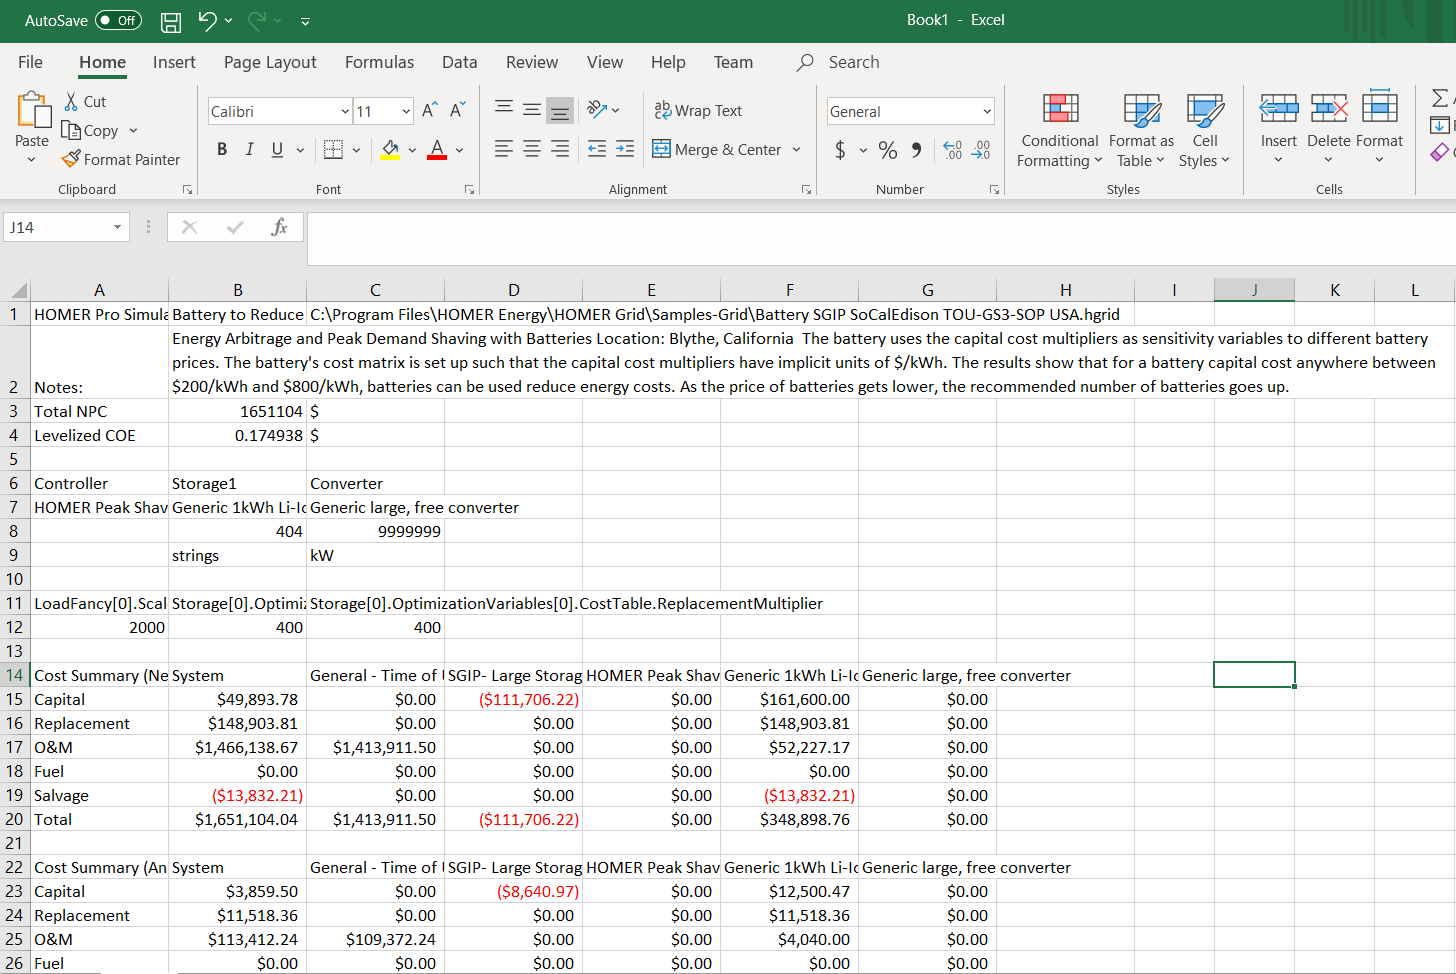
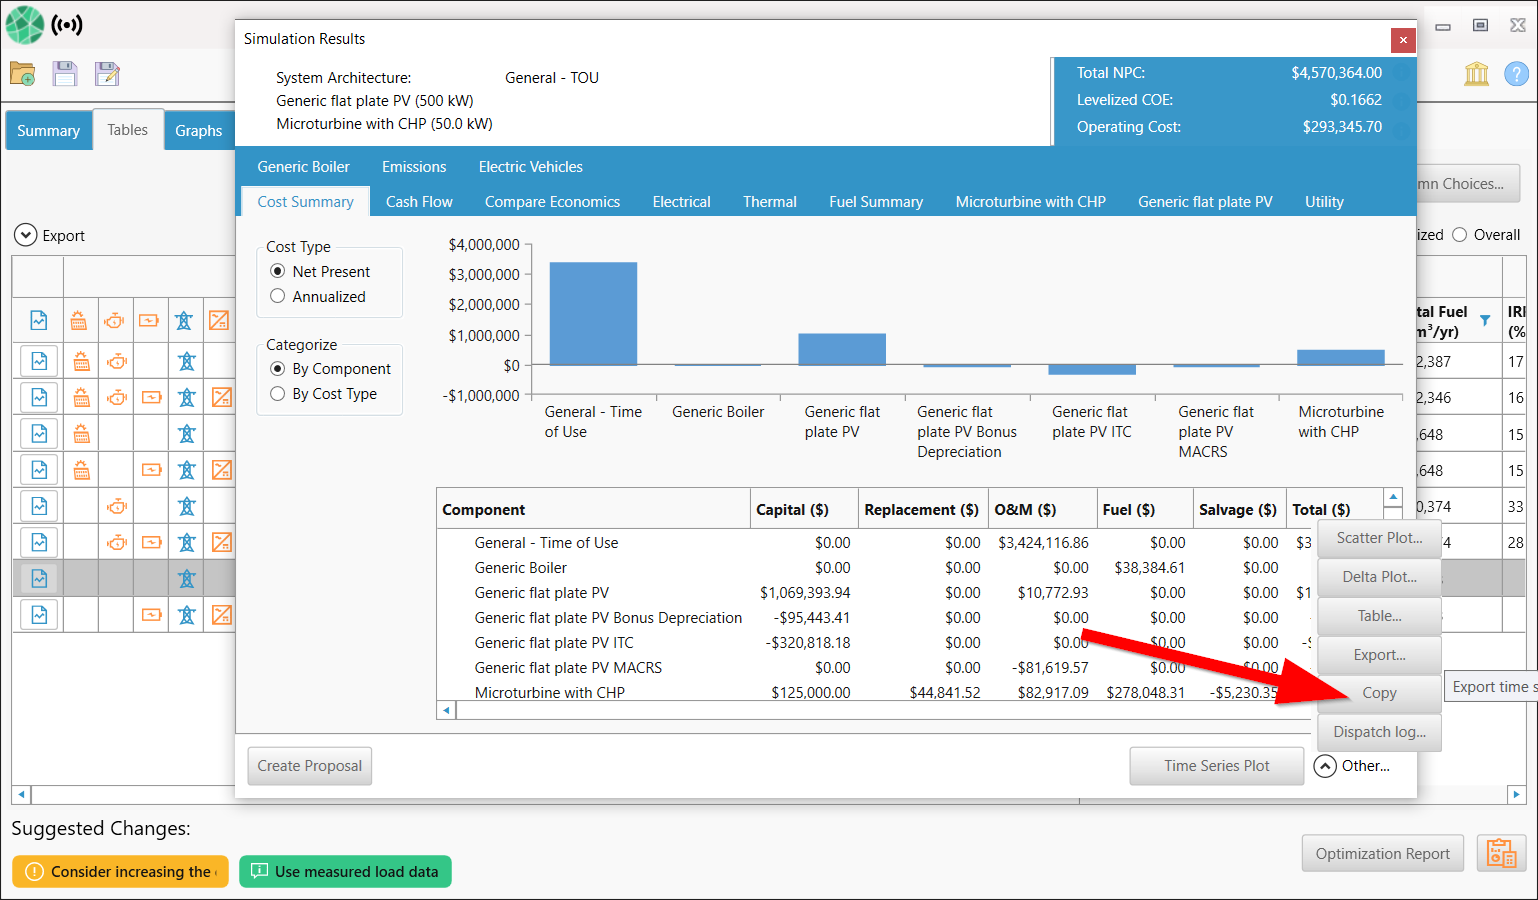
•The Copy button copies the results to your clipboard. You may paste the results into a spreadsheet application. The copied data is structured so that the outputs generally stay in the same place from one simulation to another, so that you may integrate these outputs into your own workbook tools
Below is an example of the data from the "Copy" feature pasted into an excel workbook: