
HOMER Grid 1.9

The Optimization Surface Plot allows you to view the way the value of one result variable changes over the range of two Optimization Variables. Typical inputs for this plot are: PV capacity and storage quantity on the x- and y-axes, and Total Net Present Cost as the result variable to plot. Like the Optimization Plot (above), first select the sensitivity case from the Sensitivity Variables drop-down menus. Then choose an optimization variable to plot on the x-axis and one for the y-axis. Choose fixed values for the remaining Optimization Variables. You can only set "x-axis" for one variable, and "y-axis" for another variable. If you make an invalid selection (i.e., selecting "x-axis" for more than one variable), the plot does not refresh until you fix the selection.

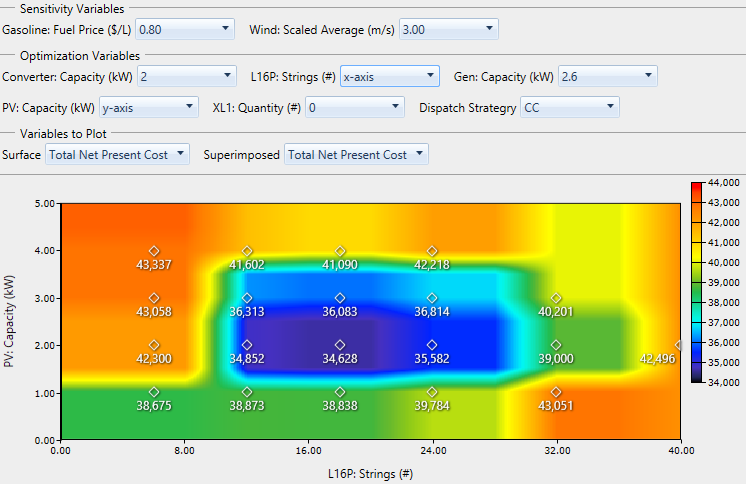
The Superimposed drop-down menu under Variables to Plot allows you to choose a second results variable to show on the plot at each point of simulation on the plot. In the image below, Total Net Present Cost is superimposed. This is the same quantity that is drawn as the surface. It lets us see which points were actually simulated, and how the plot interpolates and extrapolates to draw the surface. You can also superimpose a different variable than the one plotted on the surface.
To save the plot, right-click the plot and click Export as PNG. In the pop-up window, navigate to the location where you want to save the file. Enter a file name. Click Save.
To view or change properties; such as title, minimum, and maximum; right-click the plot. Click Properties. In the pop-up window, make your changes in the boxes or select them from the drop-down menu. Click OK.
See also
