
HOMER Grid 1.9

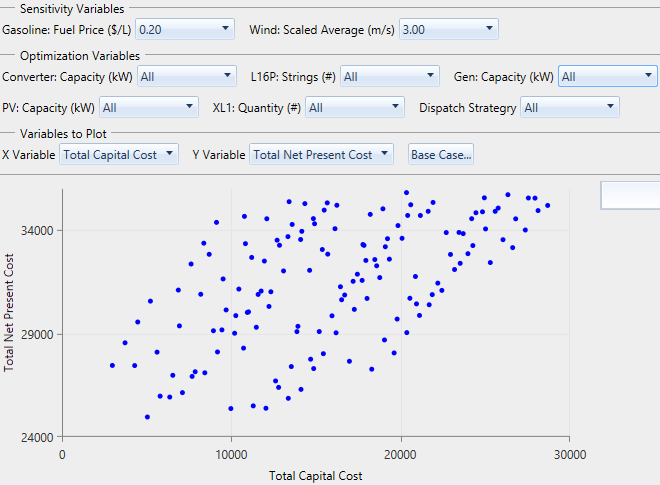
The Optimization Plot shows each simulation as a single point on a set of axes you can choose. First, choose which sensitivity case to view from the Sensitivity Variables drop-down menus. Then choose which Optimization Variables you want to see. By default, All is selected for all of the optimization variables, so you see a dot for every simulation that was feasible for this sensitivity case.
The image below is a sample from the Sample-OffGridHouseInMontana.homer file, which is available from the Samples section of HOMER's file menu. The x-axis represents Total Capital Cost, and the y-axis represents the Total Net Present cost. The winning system for this sensitivity case is the lowest dot on the plot, corresponding to the lowest net present cost (NPC). This system has a capital cost of $5,040 and a net present cost of $24,963. This system is a good balance of capital cost and operating cost, which results in the lowest net present cost in this scenario.
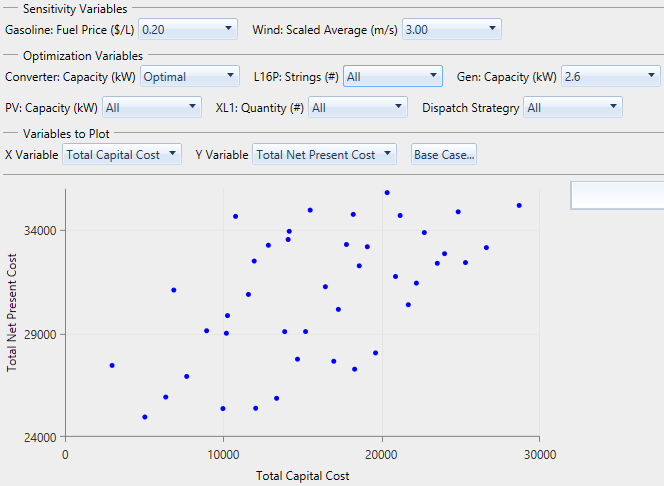
You can filter and group the points in this plot by changing the settings in the drop-down menus for each variable under the Optimization Variables section. In the plot below, the generator size (Gen: Capacity) is 2.6 and the Converter: Capacity is Optimal. The plot shows a point for every combination of batteries (L16P: Strings), wind turbines (XL1: Quantity), and PV: Capacity. For each of these combinations (i.e., 6 batteries, 1 kW of PV, and 2 wind turbines), HOMER only uses systems with the 2.6 kW generator (all the zero-size generator systems are infeasible anyway) and the optimal converter size for that case.
In the next image, the storage (L16P: Strings) is Line Series. You can only select Line Series for one of the variables at a time. With this configuration, there is a line for each combination of PV: Capacity and wind turbine (XL1: Quantity) quantity. At one end of each line is the minimum quantity of batteries (zero). At the other end is the maximum number of batteries. Each line is a different color, corresponding to the legend entry which lists the PV: Capacity and XL1: Quantity for that line. You can hover your mouse over any point to see the system architecture associated with it.
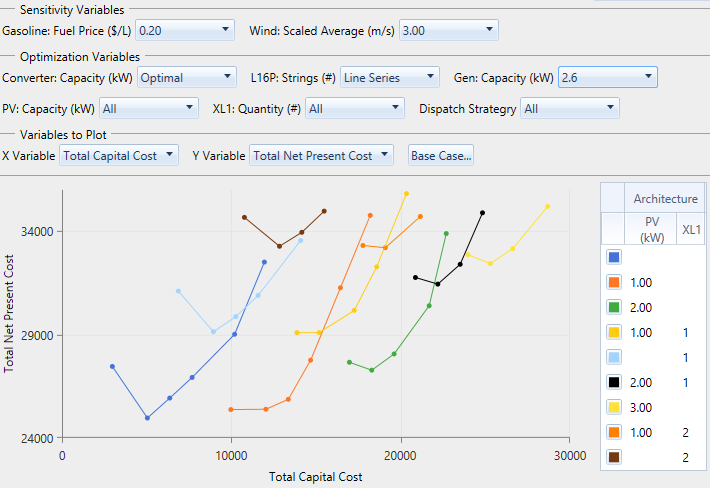
Instead of the total 18 lines (representing six sizes of PV and three quantities of wind turbine), there are only ten because when HOMER runs any optimization, it only saves the 2,000 best (lowest NPC) simulation results by default. You can change this default using the Settings option in the File menu. For a large Size your own, as shown in the "Off-grid house in Montana" example, some simulations are left out from the plot, unless you increase the number of simulations to save. HOMER always saves simulations by NPC, so only poor systems (according to NPC) are discarded. The optimization plot includes the most important simulations, but some trivial systems might not be shown.
The Base Case... button, to the right of the X Variable and Y Variable drop-down menus, allows you to choose a single simulation for comparison. This is required to compute some economic quantities. Outputs marked with (*) in the X Variable and Y Variable drop-down menus require you to select a Base Case. After you choose a Base Case, a text summary of the selection appears to the right of the Base Case... button.
To save the plot, right-click the plot and click Export as PNG. In the pop-up window, navigate to the location where you want to save the file. Enter a file name. Click Save.
To view or change properties; such as title, minimum, and maximum; right-click the plot. Click Properties. In the pop-up window, make your changes in the boxes or select them from the drop-down menu. Click OK.
See also
