HOMER Grid 1.9

![]()
The Generator page allows you to enter the cost and size characteristics of a generator. It also provides access to the following tabs where you can add information to the model:
•Fuel Resource: Specify the fuel used by the generator, set the cost, and optionally set a maximum consumption.
•Fuel Curve: Set fuel consumption parameters.
•Emissions: Enter the emission factors for the generator.
•Site Specific: Enter minimum load ratio, heat recovery ratio, lifetime, and minimum runtime.
•Maintenance: Set a maintenance costs and downtime for the generator.
•Schedule: Set the generator to be forced on, forced off, or optimized (default) according to the HOMER dispatcher.
To add a generator, click the Generator button under the Components tab in the toolbar. On the Generator Set Up page, select a generator from the drop-down list and click the Add Generator button. On the Generator page, you can manage information for the model.
Types of Generator Models in HOMER Grid
There are 2 kinds of Generators Models you can add in HOMER Grid:
Type 1: Fixed size generators
This generator is of a fixed capacity, and HOMER Grid does not let you optimize the size of this generator. The generator is either present in the simulation or not. Below is an example of a fixed size generator
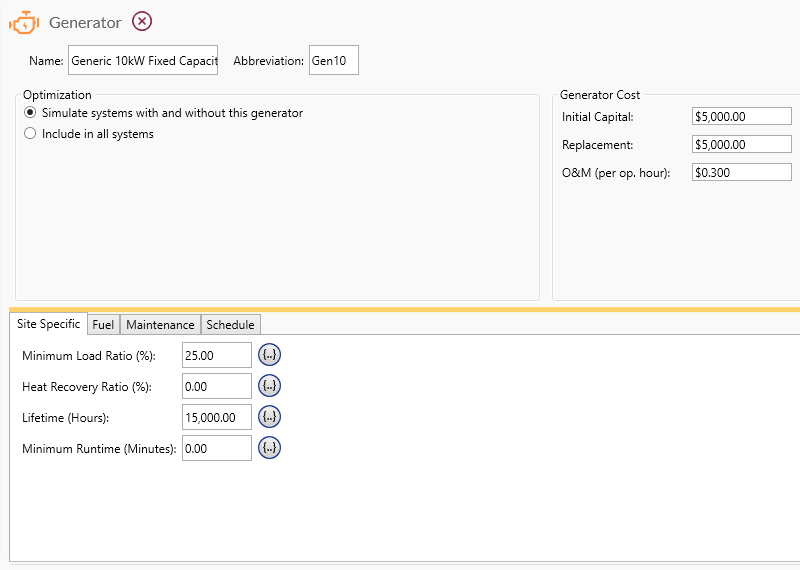
Minimum Load Ratio: Enter the minimum allowable load here.
Heat Recovery Ratio: Enter the generator heat recovery ratio here or leave at zero.
Lifetime: Enter specified hours of operation here.
Minimum Runtime: Enter minimum runtime in minutes here.
Type 2: Size your own generators
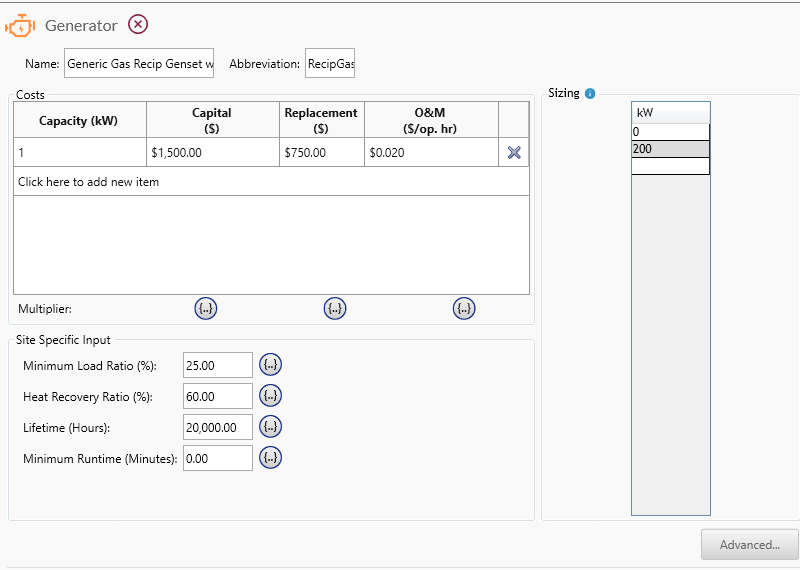
HOMER Grid allows you to optimize the size of this generator. You can specify the size in the "Sizing" section on the right. Below is an example of size your own generators.
Generator Size
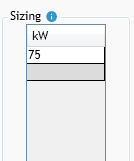
In the Sizing table, enter the sizes of the generator you want HOMER to evaluate as it searches for the optimal system. HOMER uses the information you entered in the Generator Cost table to calculate the costs of each generator size, interpolating and extrapolating as necessary. By default, after you add the generator component, HOMER only considers systems that include a generator. If you want HOMER to consider systems both with and without a generator, be sure to include zero in the Size your own.
Costs
The Generator Cost area includes the initial Capital cost and replacement cost of the generator, as well as annual operation and maintenance (O&M) costs.
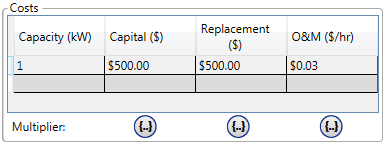
When specifying the capital and replacement costs, remember to account for all costs associated with the generator, including installation.
Note: The Capital cost is the initial purchase price, the Replacement cost is the cost of replacing the generator at the end of its lifetime, and the O&M cost is the annual cost of operating and maintaining the generator. The costs in each row should correspond to the size entered in the first column.
You can enter additional rows in the Costs table to account for changing costs with scale.
Cost Curve Example
In the Costs table, enter the generator cost curve, (i.e., the way the cost varies with size). If you have a particular generator in mind, you can enter its size and cost. For example, a 40 kW generator costs $20,000 initially, $16,000 to replace at the end of its life, and $0.60 per hour for operation and maintenance. The table below shows these amounts divided by 40 to represent 1 kW.
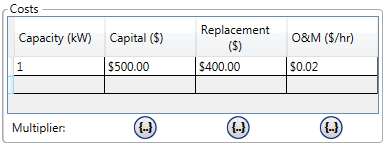
HOMER only uses this table to calculate costs, so it is equivalent to specify these costs as follows:

For both sets of inputs, the capital cost is $500/kW, the replacement cost is $400/kW, and the operating and maintenance cost is $0.02/kW per hour.
Advanced Inputs
To change the Fuel resource, Fuel Curve, Emissions, Maintenance and Schedule, click the Advanced button on the bottom right of the generator page.
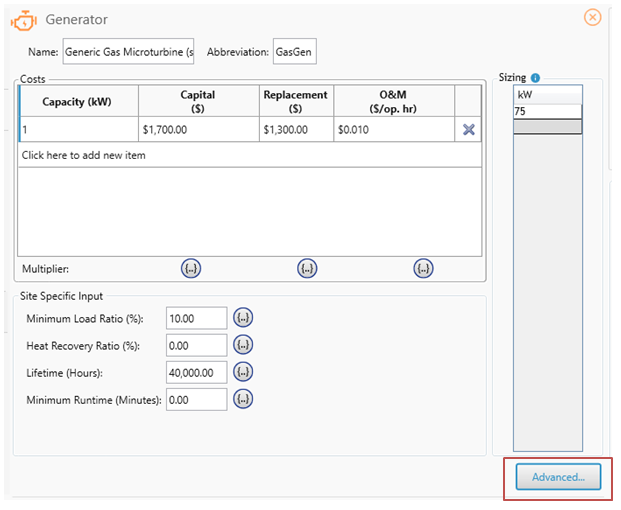
Clicking the advanced button opens up the below pop up window:
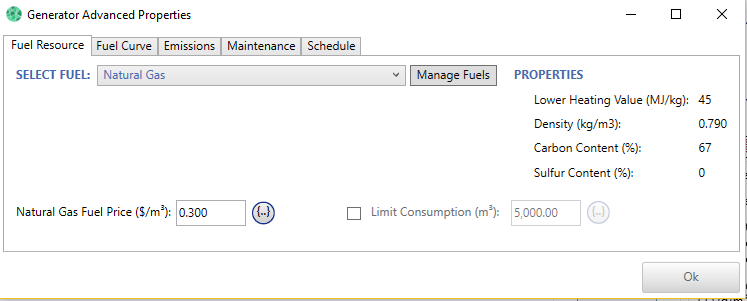
Fuel Resource
To manage the Fuel Resource, lick the Fuel tab listed under the Resource tree on the left side. The Fuel Resource page appears.
Note: To return to the Generator page, click the icon in the Schematic on the right side of the page.
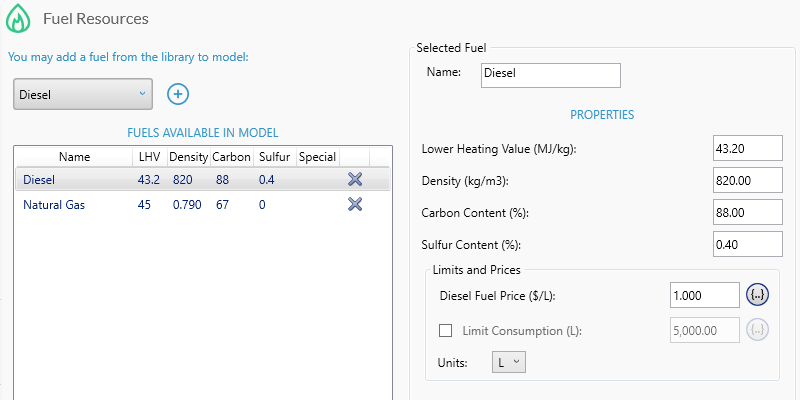
This drop-down menu contains all the fuels available in the library. Choose the appropriate fuel from this list.
Fuel Curve
Variable |
Description |
The no-load fuel consumption of the generator divided by its rated capacity |
|
Marginal fuel consumption of the generator |
See the Fuel Curve tab documentation for more information on these inputs and how to use the fuel curve calculator.
Emissions
The Emissions tab on the Generator page contains the following emissions factors input variables.
Variable |
Description |
The quantity of carbon monoxide emitted per unit of fuel consumed by the generator, in g/L* |
|
The quantity of unburned hydrocarbons emitted per unit of fuel consumed by the generator, in g/L* |
|
The quantity of particulate matter emitted per unit of fuel consumed by the generator, in g/L* |
|
The fraction of the sulfur in the fuel that is emitted as particulate matter (the rest is emitted as sulfur dioxide), in % |
|
The quantity of nitrogen oxides emitted per unit of fuel consumed by the generator, in g/L* |
*These units are expressed in g/m3 for fuels that are measured in m3, and g/kg for fuels measured in kg.
Note: To the right of each numerical input is a sensitivity button ( ) that allows you to do a sensitivity analysis on that variable. For more information, see Why Would I Do a Sensitivity Analysis?
Maintenance
HOMER can include the cost and downtime for specific maintenance tasks in the simulation. Click the Maintenance tab at the bottom of the Generator page. Check Consider Maintenance Schedule box if you want to use this option. The following inputs, found under the Maintenance tab, can be used to define a maintenance requirement.
Variable |
Description |
Procedure |
A descriptive name for the maintenance item |
Interval (hrs.) |
How often the maintenance needs to be performed, in terms of the number of hours the generator is operating or the total (calendar) hours, depending on the selection in the Type field |
Type |
Whether the maintenance interval is in terms of Operating hours (only hours the generator is on) or Calendar hours (total hours including when the generator is off) |
Downtime (hrs.) |
The number of hours for which the generator is forced off when the maintenance event occurs |
Cost ($) |
The cost of the maintenance procedure, which is incurred at the end of each maintenance interval |
Marginal cost |
Additional cost added to the maintenance event, per kW of generator capacity |
Each row in the table corresponds to a maintenance event with a name, interval between occurrences, generator downtime, and cost. You can specify the interval in terms of Operating hours (hours that the generator is turned on), or Calendar hours (all hours including when the generator is off) using the drop-down menu in the Type column.
For example, a maintenance event that occurs every 8,760 Calendar hours happens once per year at the same time and date each year. The countdown to the next occurrence of the maintenance event restarts immediately after it elapses. The countdown even runs during the downtime for the event, if there is any. On the other hand, if Operating is selected in the Type column, only hours where the generator is on are counted. The countdown to the next event begins after the downtime for the current event has elapsed, and the countdown pauses whenever the generator is not running.
Note: An event that occurs every 8,760 Calendar hours (once per year) only occurs 24 times in a 25 year project. The event occurs at the end of every year from the first year to the 24th year, but not at the end of the 25th year.
The cost is calculated based on the Cost, Marginal cost, and generator size. The Marginal cost is multiplied by the generator size, then added to the fixed Cost, to calculate the total cost for the maintenance event. For example, consider the hypothetical maintenance event "Oil change." It occurs every 1,000 operating hours, and the generator is forced off for three hours during the event. The cost is $100, and the marginal cost is $0.50 per kW of capacity. The oil change procedure costs $100, plus $0.30 per kW for the quantity of oil required for larger engines. For a 100 kW generator, the total cost of the event is $130 ($100 + $0.30 * 100).

Schedule
By default, HOMER decides for each time step whether or not to operate the generator based on the electrical demand and the economics of the generator compared to other power sources. You can, however, use the generator schedule inputs to prevent HOMER from using the generator during certain times, or force it to use the generator during other times.
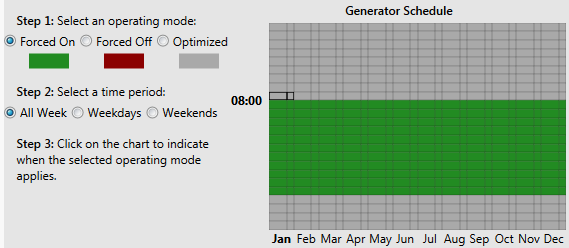
Click the Schedule tab at the bottom of the Generator page. The schedule diagram on the right side of the tab shows the times of the day and year during which the generator must operate and not operate, and when HOMER can decide based on economics. In the example below, the generator must operate between 8 a.m. and 8 p.m. every day. At all other times, HOMER can decide whether to run the generator based on economics.
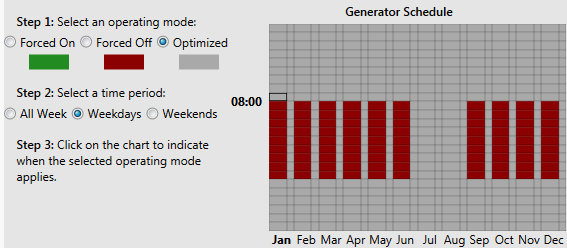
It is also possible to treat weekdays and weekends differently. In the example below, the generator may not operate during school hours, which are 8 a.m. to 5 p.m. on weekdays, except for July and August. (Such constraints are sometimes necessary in small village power systems because of generator noise.) At all other times, HOMER can decide whether to run the generator or not.
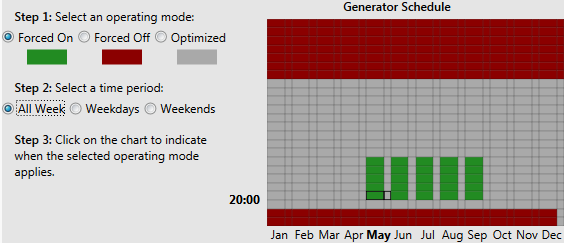
In the example below, the generator must operate during weekday evenings May through September, and must not operate before 7am or after 10pm throughout the year. At all other times, HOMER can decide whether to run the generator or not.
To modify the generator schedule, choose a drawing mode on the left side of the window, then draw on the schedule diagram on the right side of the window. For example, to force the generator to operate weekday afternoons in July:
1.Click the Forced On button.
2.Click the Weekdays button.
3.Move the mouse to the column representing July and row representing 12 p.m. to 1 p.m.
4.Click and drag the mouse to the row representing 5 p.m. to 6 p.m.
Tip: When you move the mouse over the schedule diagram, the cursor changes depending on whether you selected weekdays, weekends, or all week.
You can view the generator status, as specified by the schedule, in the time series results. The generator status is coded with a 0, 1, or 2 to correspond with the possible states.
Status |
Meaning |
0 |
Optimized / normal operation (could be on or off, dispatch decides) |
1 |
Forced off |
2 |
Forced on |
Note: To the right of each numerical input is a sensitivity button ( ) that allows you to do a sensitivity analysis on that variable. For more information, see Why Would I Do a Sensitivity Analysis?
See also
